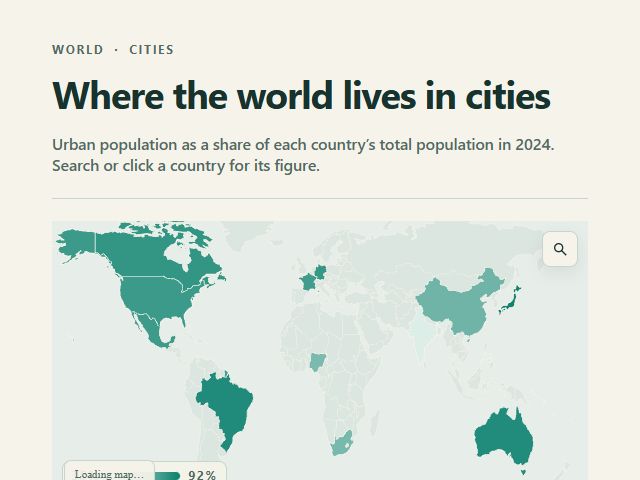
Searchable country map
Where the world lives in cities
Continuous country fills make a global rate comparable while search and the detail drawer keep each place inspectable.
Interactive mapping
Start with a question or geographic data. Build a map people can search, compare and understand — then refine every label, layer, camera and interaction before publishing.
2024 Country view
Color = urban share Search + inspect
Working maps, real data
These are live Storycards renders, not product mockups. Drag, zoom and inspect the maps here, then open the same structured template to adapt the data and design.
Searchable country map
Continuous country fills make a global rate comparable while search and the detail drawer keep each place inspectable.
A measure turned into height
Bounded 3D columns make one airport performance measure spatial without pretending the height is geographic terrain.
Reader-controlled comparison
Readers move through time while height shows population and color stays anchored to a fixed 2020 baseline.
Live-source map examples
Each example below is an interactive packaged snapshot. Connect the same template to its supported supplier and Storycards can refresh the published snapshot without exposing source credentials to readers.
Scheduled mobility data
Cluster stops, trace a selected corridor and use location to understand scheduled service. Connect SIRI when live arrival estimates are available.
Time-aware monitoring
Move through observation times and inspect individual stations. The design keeps the preliminary-data warning attached to every reading.
Autoplay observation timeline
Animate measured station rainfall over time, pause on a moment and compare exact readings without implying values between stations.
Map Studio
Use AI to get to a strong first map, then work directly with the geography, layers, camera and reader experience. Nothing is flattened into a screenshot or locked behind a prompt.
Bind place, value, latitude, longitude and time fields. Choose region and grain, review data joins and keep unmatched rows visible.
Build filled regions, proportional points, clusters, heatmaps, routes and bounded 3D data columns from the same structured dataset.
Choose a light, dark or OpenFreeMap basemap. Set zoom, pitch and bearing, then save camera scenes from the exact view.
Turn on place search, design the result and detail views, choose supporting fields and optionally locate the nearest data-backed point.
Add a reader-controlled or autoplay timeline, pick a deterministic current step and color change against an explicit baseline.
Shape sequential or diverging scales and legends while retaining an SVG version for exports, thumbnails, loading and no-WebGL environments.
Choose the geographic argument
Storycards helps match the map to the relationship in the data — and keeps the result editable when the question changes.
Compare places
Use continuous or categorical color, preserve a readable legend and keep unmatched geography visible instead of silently dropping it.
Find a place
Let readers search by place name or common code, focus the map and open a crafted detail view with the values and context that matter.
Show magnitude
Map one transparent numeric field to relative 3D columns with explicit scaling and a deterministic proportional-symbol fallback.
Explain change
Build reader-controlled timelines, compare the current step with a fixed baseline and avoid inventing values for missing place-period pairs.

From data to geography
Start with a shipped template or ask Storycards to recommend the most honest map structure. Then take over in the same Studio used for every other visual story.
Questions
Yes. Start with a question, spreadsheet or map template. The geography, data bindings, styling and interaction remain editable in Storycards.
Control data and geographic matching, layers, basemap, color scale, camera, search, place details, reader location, timelines, comparisons and camera-story scenes — without writing code.
Use country and regional choropleths, point and cluster maps, routes, 3D data-height maps, searchable locations, camera scenes and reader-controlled time comparisons.
Unmatched rows are reported for review rather than silently removed. Supported maps can match common names and geographic codes where the underlying gazetteer provides them.
Yes. Map layouts adapt to smaller frames, use touch-friendly controls and detail sheets, and retain a deterministic fallback when the live basemap is unavailable.
Yes. Connect a supported Google Sheet or API. Storycards refreshes a safe published snapshot server-side, so readers never receive supplier credentials and the last valid map remains available if the source is temporarily down.
Storycards maps
Start free with your data — or simply ask the question.
Create a mapNo credit card required.